Hermes::Hermes2D::PNGGraph Class Reference
#include <graph.h>
 Inheritance diagram for Hermes::Hermes2D::PNGGraph:
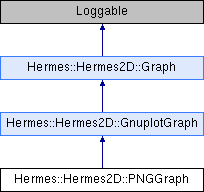
Public Member Functions | |
| PNGGraph (const char *title=nullptr, const char *x_axis_name=nullptr, const char *y_axis_name=nullptr, double lines_width=1.0, double plot_width=800, double plot_height=600) | |
| Public Member Functions inherited from Hermes::Hermes2D::GnuplotGraph | |
| GnuplotGraph (const char *title=nullptr, const char *x_axis_name=nullptr, const char *y_axis_name=nullptr, double lines_width=1.0, const std::string &terminal_str=default_terminal) | |
| virtual void | save (const char *filename) |
| void | set_legend_pos (const char *posspec) |
| Public Member Functions inherited from Hermes::Hermes2D::Graph | |
| Graph (const char *title=nullptr, const char *x_axis_name=nullptr, const char *y_axis_name=nullptr) | |
| void | set_captions (const char *title=nullptr, const char *x_axis_name=nullptr, const char *y_axis_name=nullptr) |
| void | set_log_x (bool log=true) |
| void | set_log_y (bool log=true) |
| void | show_legend (bool show=true) |
| void | show_grid (bool show=true) |
| int | add_row (const char *name=nullptr, const char *color="k", const char *line="-", const char *marker="") |
| void | set_row_style (int row, const char *color="k", const char *line="-", const char *marker="") |
| void | add_values (int row, double x, double y) |
| void | add_values (double x, double y) |
| void | add_values (int row, int n, double *x, double *y) |
| void | add_values (int row, int n, double2 *xy) |
| void | save_numbered (const char *filename, int number) |
Additional Inherited Members | |
| Protected Attributes inherited from Hermes::Hermes2D::GnuplotGraph | |
| std::string | legend_pos |
| std::string | terminal_str |
| double | lw |
| Protected Attributes inherited from Hermes::Hermes2D::Graph | |
| std::string | title |
| std::string | xname |
| std::string | yname |
| bool | logx |
| bool | logy |
| bool | legend |
| bool | grid |
| std::vector< Row > | rows |
Detailed Description
The documentation for this class was generated from the following files: